VISIT MY ACCOMPANYING BLOG ==>
retailinvestor420.blogspot.com
By Definition, a Pivot Point is a Point of Rotation. The prices used to Calculate the pivot point are the previous period's high, low and closing prices for a security. These prices are usually taken from a daily chart but the pivot point can also be calculated using information from hourly charts. As they are widely used , it makes complete sense to have awareness/understanding of the same. Floor Pivot Points
The floor pivot points,are the most basic and popular type of pivots
used in Technical Analysis. The pivot point
is interpreted as the primary support/resistance level — the point
at which the main trend will be born. First-third level resistance and
support points serve as additional indicators of possible trend reversal
or continuation. The rules to calculate floor pivot points are - Pivot(P) = (H+L+C)/3 Woodie's Pivot Points
Woodie's pivot points are similar to floor pivot points, but are
calculated giving more weight to the Closing
price of the previous period. The Formulae for calculating
Woodie's pivot points are- Pivot (P) = (H+L+2×C)/4 Camarilla Pivot Points
Camarilla pivot points seem to work quite well for day trading .Camarilla pivot points can be calculated as- R4 = (H−L)×1.1/2+C In Due Course of time , I shall be putting Indepth Analysis of Camarilla points , along with explanation/Demonstration with the help of a chart/s. Tom DeMark's Pivot PointsOther popular method of calculating Pivots to forecast the future of trend is Tom DeMark's pivot points, which are not pivot points exactly, but are the predicted lows and highs of the period.They are calculated asIf Close < Opencurrent Then X = H+2×L+C; If Close > Opencurrent Then X = 2×H+L+C; If Close = Opencurrent Then X = H+L+2×C; New High = X/2−L; New Low = X/2−H ; Remember:Current Period's Trading Range is derived from the High,Low&Close of previous period together with Opening price of the current period, ie. To Say,If The Opening Price Today Is above (Higher Than) the Closing price of yesterday,Then We Use The First Formula ,X=H+2XL+C ,And The Projected High/Low For The period Shall Be New High=X/2-L & New Low=X/2-H. FOR THE BENEFIT OF INVESTORS/TRADERS , WHO DO NOT SUBSCRIBE TO LIVE CHART SERVICES, I HAVE PREPARED THIS FIBONACCI EXCEL SHEET ,WHICH CONTAINS THE IMPORTANT RATIOS (YOU MAY ALSO ADD OTHER FIB. RATIOS AS PER YOUR LIKING AND REQUIREMENT) _____________________________________________________________________________________________________________ http://in.ipanelonline.com/register.html?inviter_id=371492 -A nice survey site , which is very prompt in its payments,register with the link provided, survey invitations comes to your email inbox,just be truthful in the opinions you provide.
UNDERSTANDING "CAMARILLA" CAMARILLA PIVOT POINTS Are my favorite , like whenever i do Intra trading, which to be frank , now i don't do much,after i have started generating decent cash online,with other sources of income,(Though i am an active swing/positional trader,and i tend to wait patiently for my trade setup)but as i have decided, i shall be sharing all that i know of and have learnt over the years. Just a kind reminder again, if you do have to do intra-day trading , learn all that you can about the SELECTED MARKETS,in which you do day trading-I am yet to meet a person , who has successfully made money by taking calls! Camarilla Equations were discovered while day trading in 1989 by Nick Stott,a successful bond trader in Financial Markets.It uses the principle that most time series have a tendency to revert to mean,ie when markets have a wide spread between the high and low the day before,they tend to reverse and revert back towards previous day's close.The Camarilla Equation uses today's Open,High,Low,Close and projects 8 levels for tomorrow which are split into 2 groups , numbered 1 to 4 ((S4--S1;;R1--R4)).Traditionally,the day traders would look for the market to reverse if it hits R3 level,and open a position against the trend, though prudence suggests,not to open a trade till the time price action suggests that is has found resistance or support. Another way to day trade using camarilla , would be to regard R4 level as a breakout level,ie to trade with the trend , if the price action pushes through the S4/R4 levels. TRADING WITH CAMARILLA POINTS Basically the Camarilla Equation used todays open,high,low and close and projects 8 points for tomorrow, 4 above and 4 below the today's close.Important levels to note are R3/S3 levels,where we take action and R4/S4 levels act as our stoploss points.How we specifically trade depends to a great extent as to where the market opens. _____________________________________________________________________________________________________________ http://in.ipanelonline.com/register.html?inviter_id=371492 -A nice survey site , which is very prompt in its payments,register with the link provided, survey invitations comes to your email inbox,just be truthful in the opinions you provide. 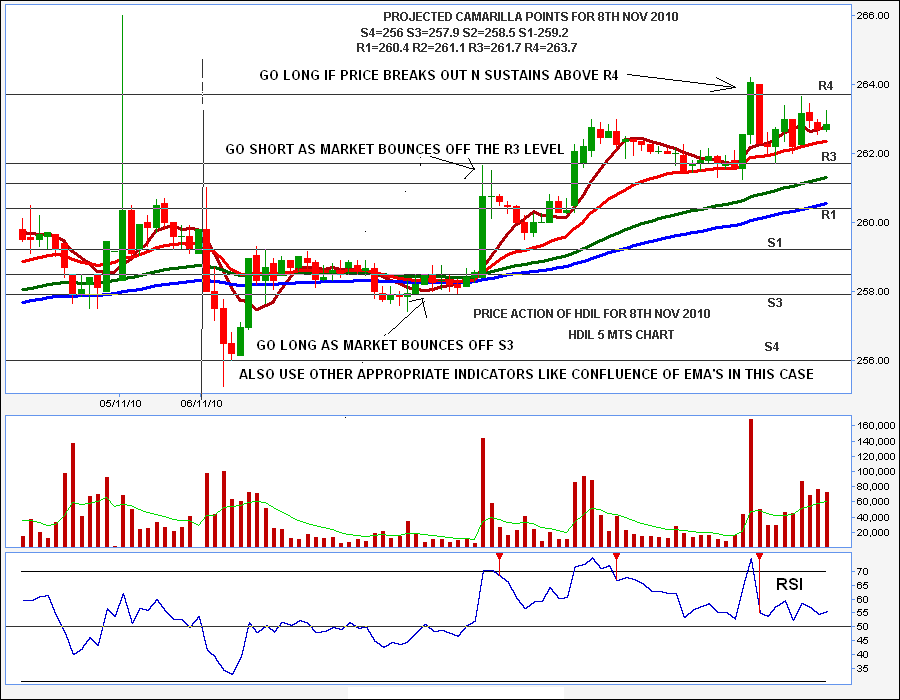 I shall now discuss various scenarios in regards to where the market opens.
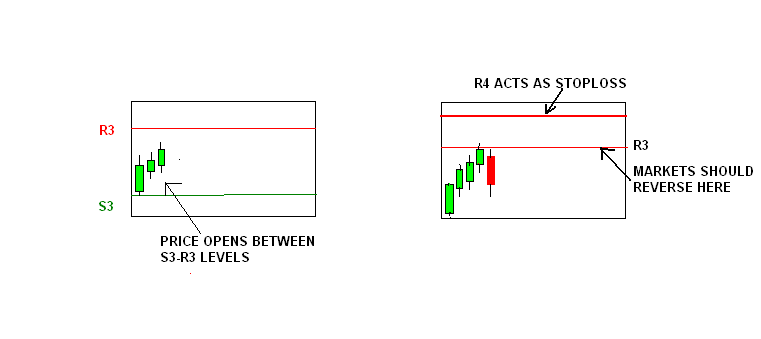 If R3 is hit,idea is to go short (ie against the trend) in the expectation that the market is about to reverse,with R4 acting as our stoploss point.Though the prudence suggests, that one should wait for the prices( AS I DO) to bounce back down into R3 level again before entering the trade,as then we would be trading with the short term trend.Vice-Versa if S3 is hit first.
HOPE THE EXPLANATION THAT I HAVE GIVEN ON CAMARILLA PIVOT POINTS IS USEFUL TO THE READERS,AND IMPROVES THE TRADING PERFORMANCE OF THE READERS OF THIS SITE. _____________________________________________________________________________________ http://in.ipanelonline.com/register.html?inviter_id=371492 -A nice survey site , which is very prompt in its payments,register with the link provided, survey invitations comes to your email inbox,just be truthful in the opinions you provide. |
MY BOOKSHELF A) BOOKS ON FUNDAMENTAL ANALYSIS
B) BOOKS ON TECHNICAL ANALYSIS
C) MISCELLANEOUS BOOKS
|
