I Must declare at the start , I am a hardcore fan of Candlestick way of charting,They are flexible,can be used alone or in combination with other technical tools,these charts send signals not available in other types of charts. This charting
technique has been in use by Japanese for centuries.Technical Analysis help measure the irrational(emotional)component present in the markets,(Humans react consistently during similar situations),and CANDLE CHARTS do this quite well.
As is the case with other charting techniques,we need OPEN, HIGH, LOW and CLOSING price of a market for a given time period to construct a candle chart.
The body of the candle is called real body, and represents range between the open and close price of the market.A
black(or filled-in body) represents that close during the time
period was lower than the open,and the white body means that close was higher than open.The thin vertical line above/below
the real body is called upper/lower shadow, representing high/low price extremes for the period(30 mts/hourly,eod-end of day,weekly,monthly)(See figure1). Now i will go straight to reversal patterns,followed by continuation patters,and along with that,shall try to give simple explanation to individual/multiple candlesticks lines/patterns. REVERSAL PATTERNS:
We must determine the trend ,before we can utilize
candle patterns effectively.Use of moving averages work quite well with Japanese
candle patterns(Again ,as i wrote,in basic investors awareness page of my blog- Always get used to using Fibonacci numbers at moving averages-3,5,8,13,21,34,55,89,144,233-forget about 200 SMA/EMA)
- HAMMER AND HANGING MAN-Same Formation,can be bearish or bullish depending on where they appear in the trend.If such a line emerges during the downtrend-after a correction,market may be forming a bottom-'Hammering out ' a base(obviously coupled with other indicators,analysis of /monthly/weekly/and fundamental analysis of stocks/stock markets-like to say the 8000 sub levels were sure an easy base to catch-Sentiment Analysis-Exodus of Retail investors standing in line to park their money in fixed deposits-as though the world is going to fall apart-and India is coming to an end-OUR STORY HAS JUST STARTED!).If appears after a rally,signifies,late entries shall be left hanging with their positions- Greater Fool Theory.Ideal formations should have a Small real body near the high with long lower shadow and with little or no upper wick. - color of body not significant,The length of lower shadow being at least twice the length of the real body;(More the better,and if the low is formed at a golden ratio of Fibonacci,or like support/bullish rejection from lows happens at a support/resistance/ema 55-89-144 etc coupled by bullish indications from indicators like RSI jutting above the 50 level mark -breaking the trendline-Reason to even more bullish.
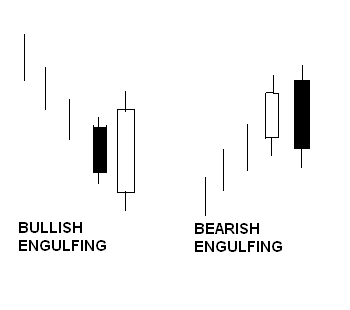
Also , implication is so easy to apprehend,market did made a low which was quite below the high of the day , but at the low point,heavy buying came-that particular price zone acted as a nice support area,and markets finally closed at/near the high end of the day.just that if this candle forms on comparatively low volumes(with RSI still below 50 mark or showing negative divergence etc..),you got to be wary.- ENGULFING PATTERN - Major Reversing candlestick pattern formed with two opposite color real bodies.Criteria for engulfing patterns(bullish or bearish)
- The Real Body of second day completely engulfs the Real Body of first day.
- Prices have been in clearly definable uptrend or downtrend,even if the trend is short term.
- Body of second candle is opposite to the color of first candle,exception being when the first body is a doji or a very small real body.
Here again,A person has to see the volume pattern(high volume on a red engulfing line would give bearish engulfing pattern lot of strength);r;ead/analyze the indicators(eg.RSI is overbought and showing negative divergence on hourly/end of day charts;;the market is well above its previous highs and is trading at 161/261% of its previous up/down swing-A retracement at these levels is mostly expected ,and if we see an engulfing pattern , we sure can enter the trade with great confidence;;Also,keep in mind,if this pattern appears after a relatively fast move,expect profit taking as the fast move make the market overextended(in such a case ,retracement from anywhere between 38.2-61.8% may be expected.)
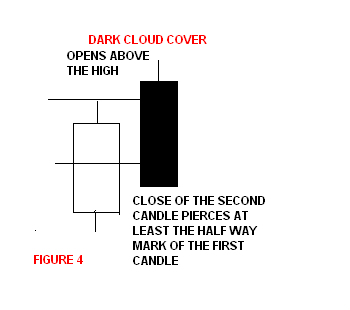
- DARK-CLOUD COVER - The Dark Cloud means gloom for an uptrend - a large bodied white candle
is followed by a higher but red or black candle that closes at least
half way into the first candle,top reversal pattern,which again should be confirmed with other indicators,(volume,selected indicators,Fibonacci retracements,moving averages)but greater the degree of penetration of the second candle,more likely the top will occur.
-
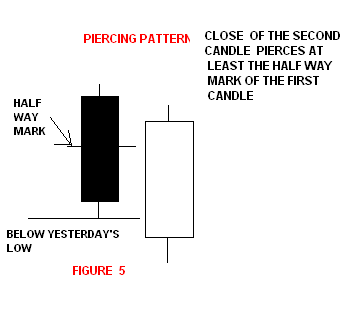
PIERCING PATTERN - (opposite of Dark Cloud Cover – Bullish Pattern) -- The first candle is black and the second is white,which opens lower than the low of the first candle and closes more than half way up the first-black candle;The point to note is that for this pattern ,the downtrend has to be evident for a good period,the black candle occurs at the end of the downtrend.This pattern at the end of the day would leave bears wondering about their decision to carry shorts,ie.if this pattern is also confirmed by other indicators also.
ON-NECK ,IN-NECK AND THURSTING PATTERN - See the Figure to the right,Though the formation of the three pattern is similar to the piercing pattern , these three are read/seen as bearish as the white candles fail to pierce into the halfway mark of the first black candle. [[BEFORE I PROCEED AHEAD , I SHALL BRIEFLY EXPLAIN WHAT IS A SPINNING TOP AND WHAT IS DOJIA spinning top is a candle with small body and long lower and upper shadows. This
candle represents a neutral position in which neither the bulls or bears
are able to gain control during the trading session. The color of the
real body is irrelevant as the body of the candle is so small. If a
spinning top arises after a strong uptrend or downtrend, it is an early
sign that the trend could be reversing.
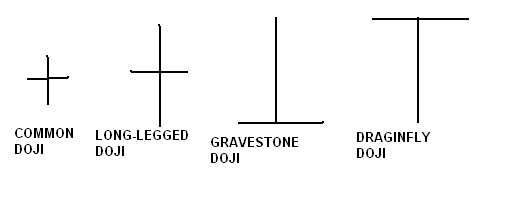
- DOJIS – They occur when open/close for the session are same or very close to being the same,can be a potentially strong reversal signal if comes at specific points of the price chart,or forms a part of the various multi-line candle patterns;There can be various forms/types of dojis and I shall briefly cover them below, with diagrams ,of course;Common dojis have a relatively small trading
range & reflects indecision; Dojis can
sometimes turn into a support or resistance zones.
- THE LONG LEGGED DOJI is especially Important doji at tops.it has long upper
and lower shadow , clearly reflecting indecision,(
longer the upper shadow – bearish the
interpretation ).If there is a non doji session
with a very long upper and/or lower shadow , the line is called high – wave
line. a group of high wave candles are a reversal formation.
- THE GRAVESTONE DOJI has opening and closing prices at the lower end of the
session.though it can be found at the bottoms , it has much more stronger
implication at the tops.'Rationale for bearish implication' – The Market opens at low of the session – then rallies (
preferably to new highs of the move,ie takes out last day's high or high of the last upswing ) – thence the price plummets to the day’s low,(longer the upper shadow – more bearish the implication.
(A trader should always mark the open and close price(Also weekly open,or monthly open)of the stock/market that he/she is trading because these are
the two most emotionally charged points of the trading day – As said by many professional traders-The first 30 mts of
the morning is the rudder of the day,Also one should avoid trading in the last 30 minutes of the day-As Steve Nison beautifully explains about Morning And Evening Attack-Remember why the close price is emotionally charged up- margin calls for future,plenty computer trading systems-moving averages systems ,are based on closing prices,Lot of Intra traders stuck with their positions would have to cover their positions at whatever prices they get) 3. THE DRAGONFLY DOJI - Depicts a day on which prices opened at a
high, sold off, and then returned to the opening price,
usually considered quite bullish,Again comparing with other indicators(Volume,RSI Divergence,or stock already not overbought,touching/jutting out of the Upper bollinger band,scrip 's Fibonacci position in comparison to the last swing)]]
http://in.ipanelonline.com/register.html?inviter_id=371492 -A
nice survey site , which is very prompt in its payments,register with
the link provided, survey invitations comes to your email inbox,just be
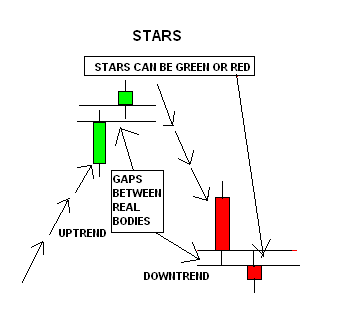
truthful in the opinions you provide._______________________________________________________________________________________________ STARS - Stars have small real bodies which gap away from a large
real body that precedes it,Color of the star is not important.Key rule
being that the real body of does not overlap the previous candle's real
body.It forms part of the important reversal patterns like
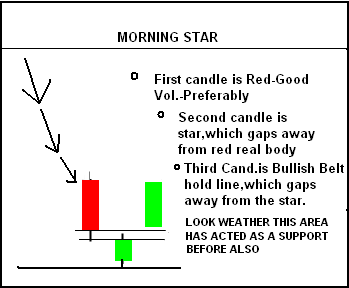
morning/evening star.- MORNING STAR -(Takes three candles for this formation)This is a Bottom Reversal Signal that comes after an extended downtrend.Third day’s white real body should move well
within the first period’s black real body.(Bullish Belt Hold Line is the one which has a clean shaven bottom or a very small lower shadow)[Called a Morning Doji star if the second candle is a Doji][[Remember:These or any candle formations when used correctly with other indicators- like weather the price zone at which candle formations have appeared ,are/were previous strong support/resistance;weather the scrip is trading somewhere near the golden retracements,what are your indicators suggesting--USE MAX 2 INDICATORS AND KNOW ALL ABOUT THEM;-- Can be really powerful tools for trading short or long term]]
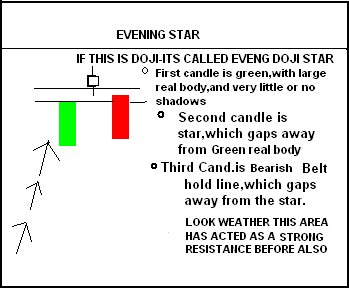
- EVENING STAR- (Takes three candles for this formation)This is a Top Reversal Signal that comes after a sustained upmove.The real bodies of all three candles do not overlap each other;First one is a green candle(preferably with large real body),third red candle pierces well into the first green candle,with volume pattern supporting the move.[Called a Evening Doji Star,if the second candle is a doji]
- SHOOTING STAR AND INVERTED HAMMER -
Shooting Star -( a Top Reversal Line)It has a small real body at the lower end of its range with a long upper
shadow .Color of real body is not important. shooting star pictorially
tells us that market opened near its lows , then strongly rallied and finally
backed off to close near the opening.in other words ,that session’s rally could
not be sustained.(Similar to Gravestone Doji form , just that instead of Doji , it has a small real body at the lower end of the trading range) An Inverted Hammer -( a Bottom Reversal Line)Looks like a shooting star with its long upper shadow and small real
body at lower end of its range (with little or no lower shadow), colour of the real body is not important.It is
important to wait for bullish verification on the session following the inverted
hammer as the price pattern that forms inverted hammer is
bearish)SOME MORE REVERSAL PATTERNS:
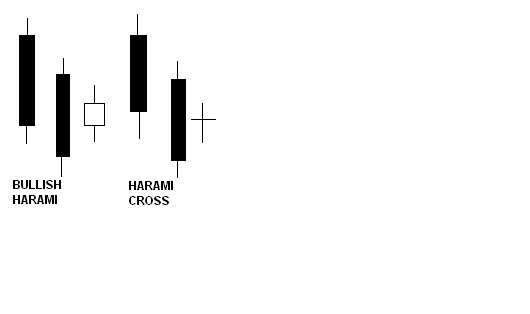
- HARAMI PATTERN - Small real body
contained in prior relatively long real body.the colour of the small real body
is not important (comparable to “ inside day”.) the harami requires a narrow opening and closing range ,
ie. a small real body , to be within the
prior wide opening and closing range , ie a tall real body.((If there is a Doji instead of a small body, it is called Harami Cross-Much Stronger Reversal signal comparatively.))
- TWEEZERS TOPS AND BOTTOMS - Similar to double tops and bottoms.
(((Now there are few other Reversal patterns,Which i am not covering here,if you have reached till here,and have started developing taste for candlesticks pattern , you would do well , to grasp steve Nison's book on candlesticks,Also ,His Videos Are There which were very informative to me.)))
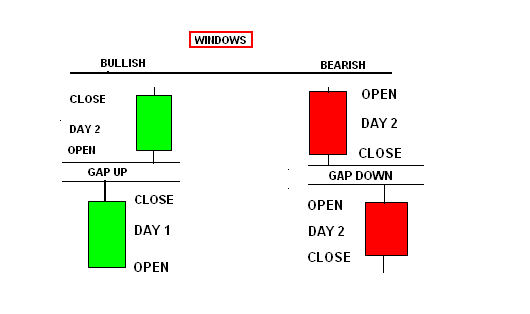
CONTINUATION PATTERNS- Most of these patterns represent a consolidation period , before the market resumes its prior trend. - WINDOWS - ( Or Gaps)-Gaps signifies no price action in that particular range.Often after a gap, prices will retrace to "fill the gap". (Though more than often,the gap is not completely filled).This
occurs quite often. Think of a gap as a hole in the price chart that needs to be
filled back in. Another common occurrence with gaps is that once gaps are filled,
the gap tends to reverse direction and continue its way in the direction of the
gap.
((Please note there are various types of gaps,and are explained in very simple terms in Steve Nison's book-The point here is every institution/author wishes to sell his/her book,but if there is someone like me,who is bent upon putting down all the facts,you may do rather well to hear/read them-Study the correct books by the legends,I shall provide the names-ie if your are unaware and are a fresher etc.
Also,the presence of number three time and again ,at numerous places in technical analysis amazes me,it is believed ( By Japanese),that if a gap-formed in an uptrend markets-is not filled in three days,the markets shall rally!))
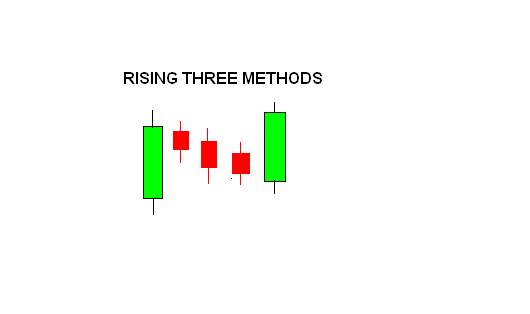
- RISING THREE METHODS - Bullish continuation pattern,starts with long white candle, generally occurring after a prolonged uptrend,which then is followed by series of small real body (black preferably) candles,which stay within the real body of the first white candle;The pattern is completed with a long
white candle at the end which typically closes higher than the first
candle’s closing price;Point to note here is that during the consolidation(2-4..small black real bodies days),the prices fail to break the low of the first white candle,which then may easily be used as a stop loss(actually,preferably a tad bit lower than the low of the white candle!)
- FALLING THREE METHODS - Starts with a long black candle, generally occurring after a prolonged downtrend;Then followed by few small bodied white
candles in the middle, all trending upward and all closing within the
range (preferable real body)of the first black candle.Pattern is completed with a long black candle at the end which closes lower than the first candle’s closing price.((Point to note here is that the series of short white candle up days fail to propel
the market above the opening/high price of the first candlestick,so a nice trade setup would be a 'Short Trade',with the stop loss at open/high of the first candle-Again preferable ,a tad bit higher than the high of the first black candle!)
-
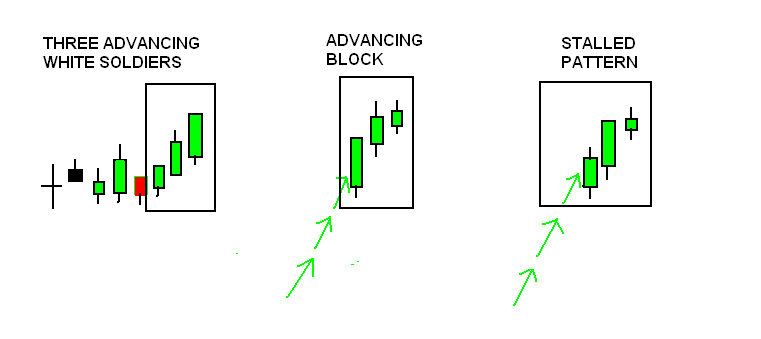
THREE ADVANCING WHITE SOLDIERS- These are the group of three white soldiers with consecutively higher closes.This pattern portrays a gradual and steady rise in the stock prices,each white candle after the first one opening within the real body of the prior white candle and closing above the previous day's high.Important point is where this pattern has appeared,if this appears after a steady decline-and consolidation of the prices and supported by other indicators, (As previously also stated-RSI/ULT/Fibonacci Retracement level/Moving averages-ie. the slope of the curved moving average line/Also assuming that you are aware of at least the basic fundamentals of the company-What business the company is into,Debt,Promoter Holding,Average of last 5 years EPS,EPS of Last few quarters....You don't want to be trading a company on delivery basis with 2-5-8 % Promoter Holding!).,it sure is a set up for a good long trade(Swing Trade),with low of the first candle as the good stop loss.
This pattern either ends a downtrend or signifies that the stock is moving out of a
period of consolidation after a decline.
- ADVANCING BLOCK / STALLING PATTERN - If the second or third candle shows weakness( ie reducing range or a smaller real body,or longer shadows,it tells trouble ahead,a trader may well do to at least book his positions partially,Also,As i have also pointed all along this page,carefully Analise the price zone,where this pattern appears,like if it appears at 161% of the last swing-You can be very generous in booking your positions.
Stalled pattern,is when in an uptrend,the last two white candles( with increasing real bodies and higher high)are followed by a small white candle-Bulls being tested-Signifies a temporary halt ,at least in the up-move. THIS MORE OR LESS COMPLETES,WHATEVER I WANTED TO SHARE ABOUT CANDLE-CHARTS,NOW THE EXPERTISE COMES/WILL GRADUALLY COME WITH EXPERIENCE AND HARD-WORK;I SHALL AGAIN RE-ITERATE HERE,THE FRESHERS WOULD DO WELL TO GO THROUGH STEVE NISON'S BOOK/VIDEO AND MASTER 2 INDICATORS,FIBONACCI NOS./RATIOS/RETRACEMENTS,AND MOVING AVERAGES AND SELECT YOUR MARKETS/STOCKS (ie. for trading purposes),KNOW THEM WELL(ie know them fundamentally also),AND YOU SHALL DO VERY WELL AS FAR AS SWING/POSITIONAL TRADING IS CONCERNED.HOPE I HAVE DONE WELL IN WRITING THIS PAGE.
 |
|
|